Signal to noise of a point source
A quick summary of basic signal to noise (S/N) calculations of CCD imaging data.
1. Number of ADUs on the CCD
The simplest form of transformation from counts N [ADU] to magnitude m is
m = m_0 - 2.5 log N + 2.5 log T_exp, (1)where
m_o = zero point of system (telesope, filter + camera) and
t_exp = the exposure time.
Zero point m_0 depends on the aperture are, transmittance of the optical components, CCD sensitivity, photometric aperture size etc. For the KVA telescope, for instance, m_0 = 20.75 in the R-band. This equation ignores the effect of target spectrum (color correction), which is small when the targets are main sequence stars.
Let's use as an example an R-band observation of star B in the field of OT 546 made in June 10, 2019. Aperture photometry with aperture radius of 7.5 arcsec gives 151 356 ADUs for a 100 s exposure. Using eq. (1) one gets m = 12.80. The catalog magnitude is 12.81.
Usually one wants to predict the performance of a system by making signal to noise (S/N) calculations. In order to do so, the total throughput of the system, i.e. the fraction of incoming light that gets registered as counts on the detector, needs to be known.
Whenever light moves in a medium, it is absorbed. This is not relevant in lenses, for instance, but for instance the atmosphere is thick enough for significant absorption to occur.
When light encounters an interface, i.e. sudden change in refractive index, part of the light is reflected back. In an air to glass interface about 4% is reflected back if the angle of incidence is 0 degrees. This backwards reflection can reduced by coating the optical surfaces.
Let's take star B in the field of OT 546 again. This star has V-R =
0.33, which roughly corresponds to a main sequence star with
spectral class G5V
(https://www.stsci.edu/~inr/intrins.html).
Using a the program filterinteg (available on request) and
a spectral template of a G0V star, it is determined that a R = 12.80
star corresponds to 8.6 photons per second and square cm^2.
The aperture of the KVA Celestron C14 is 894 cm^2, so in 100 seconds
we expect 768671 photons from star B outside the atmosphere. We observed
151356 ADUs = 151356 ADU x 1.7 e-/ADU = 257305 electrons on the CCD,
indicating a total throughput (Atmosphere + telescope + CCD) of
about 33%. This can be broken down as follows:
| Component | Transmission % | Notes |
|---|---|---|
| Atmosphere | 94 | |
| Corrector plate | 87 | https://www.celestron.com/pages/starbright-xlt-optical-coatings |
| Dirt on Corrector plate | 92 | Cleaning the corrector plate by VP increased the sensitivity by 15% in 201?. Here we assume 8% "dirtyness". |
| Main mirror | 89 | |
| Secondary mirror | 89 | |
| Filter | 90 | |
| CCD sensitivity | 80 | |
| Aperture effect | 92 | 7.5 arcsec (radius) aperture, 4.0 arcsec seeing |
| Total | 39 |
The predicted throughput is a bit higher than observed. It could be that the corrector was dirtier than estimated here. If it was as dirty during the observation in June 2019 as it was prior to the cleaning, the total throughput would be 0.36.
2. Signal to noise in aperture photometry
Formulae with varying level of complexity can be devised for the S/N in aperture photometry, depending on how many noise sources are included in the calculation. Here we consider only the following sources:
- photon noise of the photons detected
- photon noise of the sky in the aperure
- the error made in estimating sky background
If there is significant dark current, it can be taken into account by replacing N_sky with N_sky + N_dark below.
It is also assumed that the photon rate is high enough so that photon noise (as well as other noise sources) can be treated as Gaussian processes. This means that the total error can be found by summing the three errors in square.
A target is measured on a CCD image with a circular aperture of radius r pixels. The sky level, N_sky ADU, is determined from a circular annulus centered on the target containing N_s pixels. The counts from the target N are computed from the total counts inside the aperture N* from
N = N* - N_A * N_sky, (2)
where N_A = pi * r^2 is the number of pixels in the aperture.
The CCD camera has a gain of g e-/ADU and a readout noise of R e-. The signal to noise in this case is
                           g*N
  S/N = ----------------------------------------------             (3)
         sqrt( g*N + (N_A + N_A^2/N_s)*(g*N_sky+R^2) )
As a example, below is a plot of S/N of data taken with the 35 cm KVA telescope in various observing conditions using the ST-8 camera. The gnuplot file making this plot is here and the data file here.
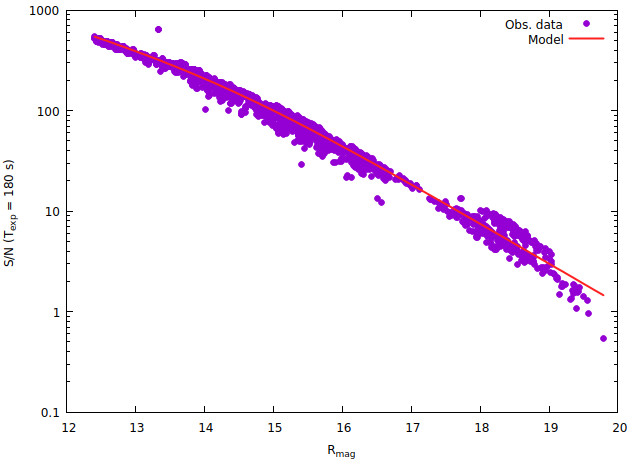
Note that in the plot above the noise in observed data is calculated from Eq. (3), so it is no surprise that the Equation fits the data. The purpose of the plot is to show the scatter in real data with respect to the model as well as validate some parameters (zero point, sky brightness) of the model.