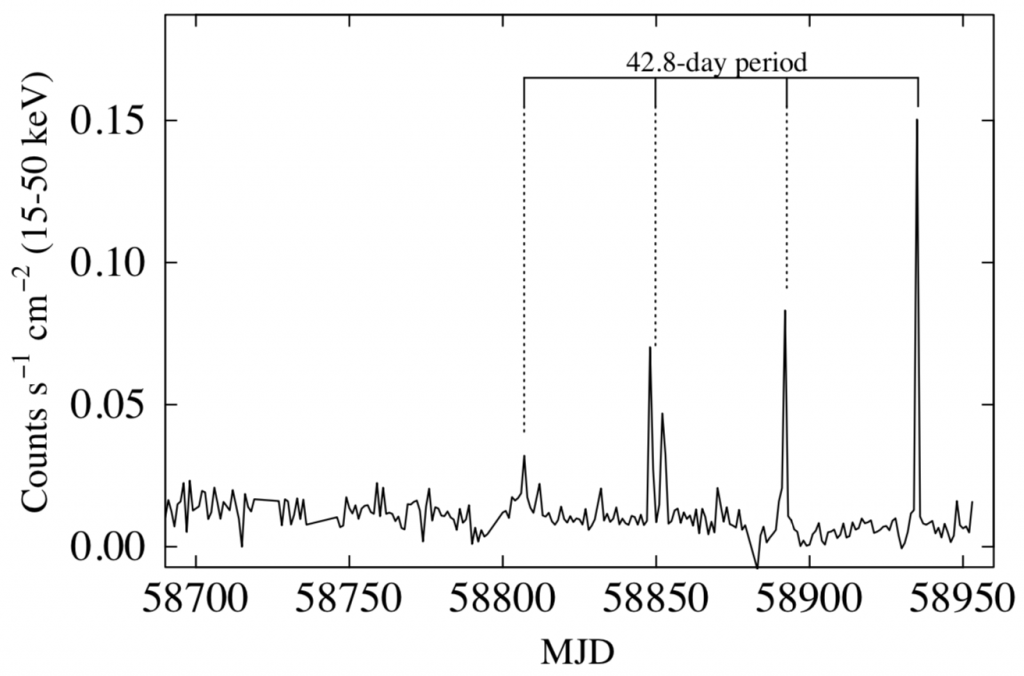
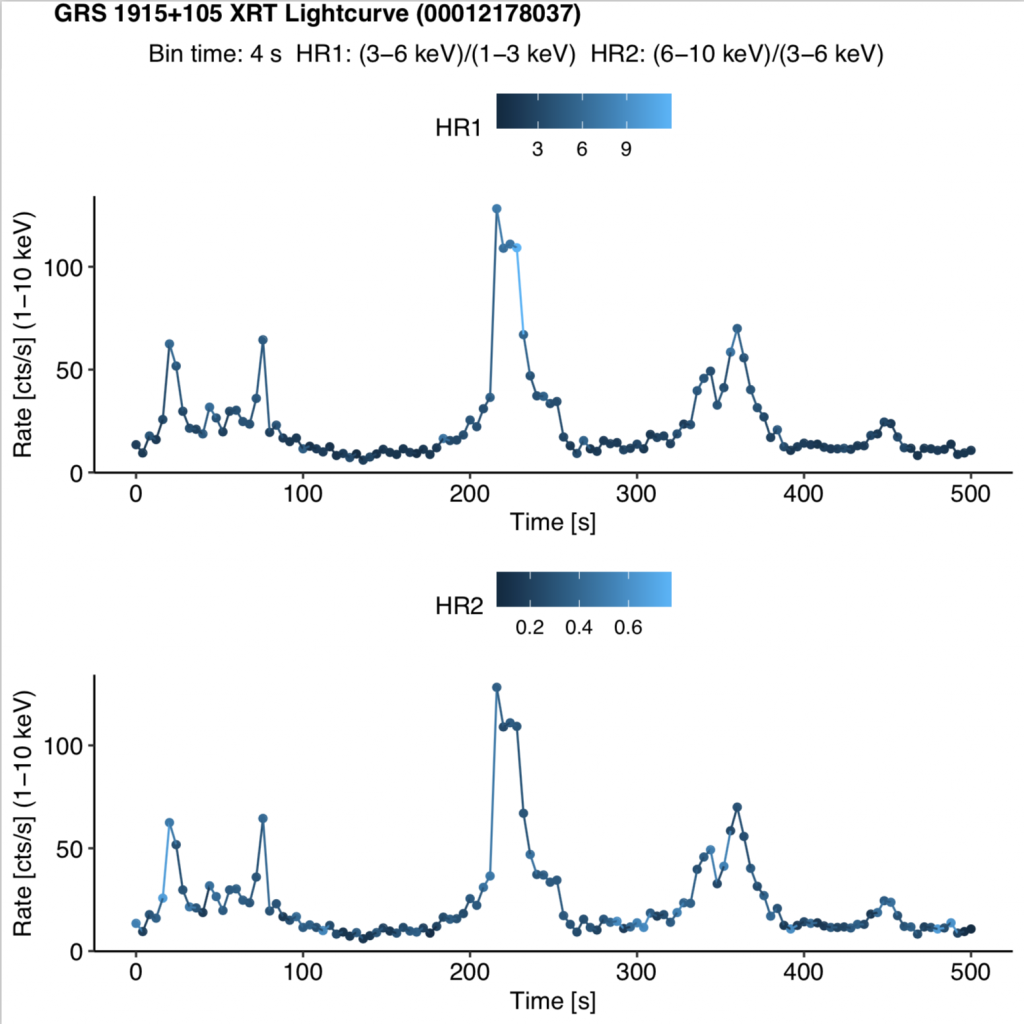
Fig. 1: Daily cadence Swift/BAT light curves of GRS 1915+105, taken during the ongoing peculiar accretion state. We recently discovered a potentially periodic (period of ∼ 42.8 days) X-ray flaring pattern (marked in the figure).Fig. 2: GRS 1915+105 Swift/XRT lightcurve (1-10 keV band) from pointing 00012178037 which coincided with the most recent (i.e. fourth) flare shown in the figure above. The color marks two hardness ratios (HR1: 3-6 keV / 1-3 keV and HR2: 6-10 keV / 3-6 keV). The flares are definitely harder than the non-flare periods. There is some evolution of the hardness ratios during the flares as well: during the rise HR2 increases, while during the decay HR1 increases.